Google PageSpeed Insights and Website Load Time: Digital Speed as a Key to Success
The Cost of Milliseconds in the Digital World
In today’s digital landscape, website load time has long surpassed its role as a mere technical indicator. Today, it is a direct measure of business stability, brand trust, and potential revenue. While most companies focus on visibility (SEO) or design (UX), the true battle for user attention is fought within the first three seconds. This is the critical window that determines whether a visitor stays or becomes lost revenue.
Let us examine the speed paradox and how the metrics we use actually measure empathy toward the customer, rather than just technical efficiency.
Why Website Load Time is Critical?
The Invisible Cost of Waiting: The First 3 Seconds as a Factor for Success or Failure
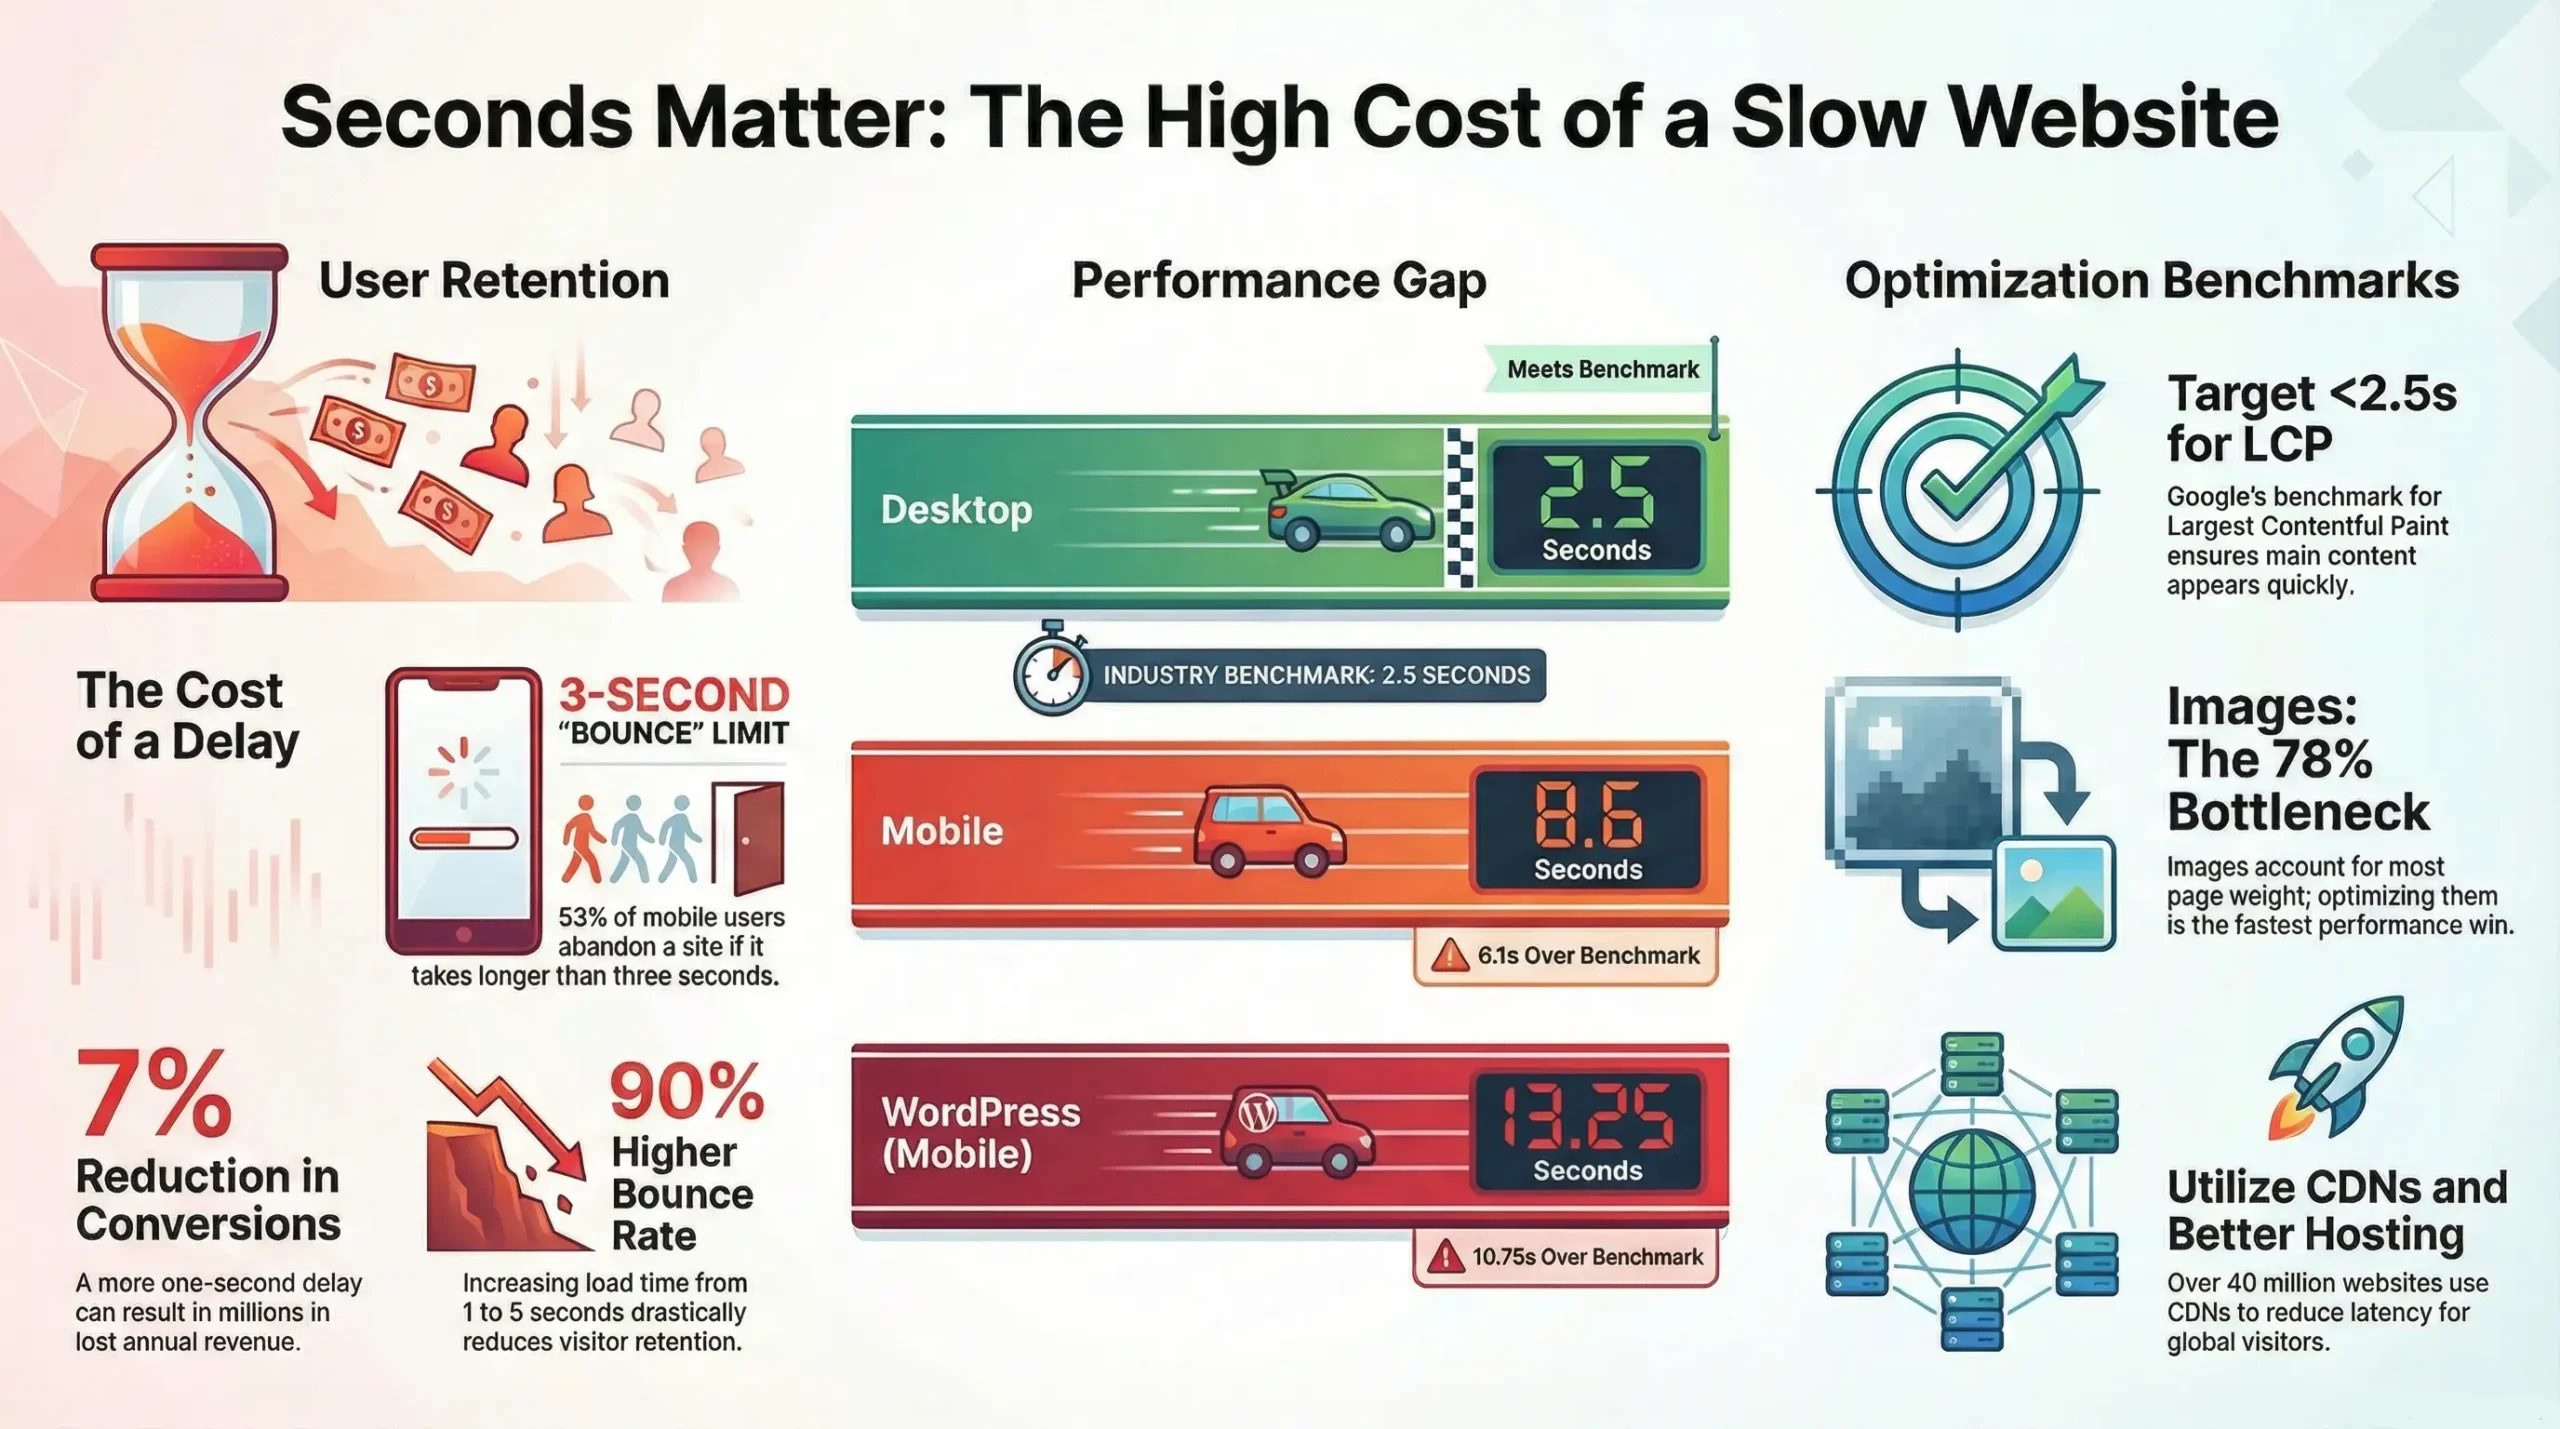
In the digital world, patience is a luxury few users can afford. Every millisecond beyond 3 seconds of load time leads to a drastic drop in engagement and conversions. Research shows that more than half of mobile users leave a site if it takes more than three seconds to load. This “invisible cost of waiting” translates into lost revenue, missed opportunities, and the erosion of consumer trust. The first three seconds are your only chance to impress and retain a visitor; make them a factor for your success.
The Mobile Paradox: Discrepancy Between Expectations and Reality on Mobile Devices
When analyzing industry standards, we notice a troubling discrepancy. The average load time on desktop is 2.5 seconds. This is close to the 2-second benchmark that nearly half of all users expect. However, the problem arises when we look at mobile devices. The average load time for a mobile website is a shocking 8.6 seconds. This gap creates a Performance Paradox: while the desktop experience is acceptable, the mobile lag is catastrophic relative to user impatience.
Since approximately 70% of shoppers use smartphones for online purchases, this mass abandonment represents a hidden and constant loss of market share. We must no longer compare ourselves to industry averages; instead, we must strive to meet the standards of our customers’ impatience.
Speed Metrics: The Language of Digital Empathy
Google has transformed technical indicators into a direct measure of User Experience (UX) by including Core Web Vitals in its ranking algorithm. These metrics function as digital gauges of customer empathy, translating technical data into a clear language of satisfaction.
Core Web Vitals as Indicators of User Experience and SEO
Core Web Vitals are a set of specific indicators that measure the actual user experience regarding loading, interactivity, and visual stability of a website. They include Largest Contentful Paint (LCP), Interaction to Next Paint (INP), and Cumulative Layout Shift (CLS). Strong performance in these areas not only ensures an enjoyable experience for users but also improves your website’s ranking in search engines.
Time to First Byte (TTFB) и неговото значение
Time to First Byte (TTFB) measures the duration from the moment the browser sends a request to the server until it receives the first byte of the response. This is the initial “digital handshake” between the user and your site. A high TTFB can signal issues with the server, network, or database, and it is critical for perceived speed.
Largest Contentful Paint (LCP): The Promise of Content and Business Results
Largest Contentful Paint (LCP) measures the time required to render the largest content element visible in the viewport. This is typically a large image, a video, or a primary block of text. LCP is a direct indicator of how quickly a user sees meaningful content. A better LCP means higher engagement and improved business results, as visitors quickly receive the content they were promised.
Interaction to Next Paint (INP): A Measure of Digital Conversation and Responsiveness
Interaction to Next Paint (INP), which recently replaced First Input Delay (FID), measures the overall interactivity of a page by evaluating the time between a user’s action (click, tap, or input) and the browser’s visual response. A low INP ensures that your website is not only fast to load but also responsive to user actions, creating a smooth and pleasant “digital conversation.”
The Hidden Culprits of Slow Speed
The Visual Burden: Images as the Leading Speed Killer
One of the most common and significant causes of slow speed is large, unoptimized images. These can account for 50% to 70% of a web page’s total size. Other frequent culprits include unnecessarily large JavaScript and CSS files, numerous external scripts, a lack of caching, and unoptimized fonts.
Optimization Solutions: Content Delivery Networks (CDN)
To address the visual burden and other causes of slow performance, several solutions are available. Using a Content Delivery Network (CDN) is one of the most effective methods. CDNs store copies of your content on servers worldwide, delivering it to users from the closest geographic location, which significantly reduces load times. Other key strategies include:
- Image Optimization: Compression, using modern formats like WebP or AVIF, and implementing lazy loading.
- Code Minification and Compression: Reducing the size of JavaScript, CSS, and HTML files.
- Caching: Utilizing browser and server-side caching for faster repeat visits.
- Server Optimization: Choosing reliable hosting and optimizing server configurations.
Do you need to improve your website’s performance? Take advantage of our Page Speed Optimization service.
The Direct Impact of Speed on Business and Reputation
Speed as Liquidity: Lost Revenue and Conversions
Slow website speed acts like a heavy tax on your business transactions. Every delay directly affects the number of completed purchases, subscriptions, or form submissions. Visitors who encounter a slow site are more likely to abandon it and seek out a competitor, leading to tangible revenue losses and low conversion rates. Speed is quite literally the liquidity of your digital asset.
The Effect on Customer Satisfaction, Loyalty, and Reputation
Dissatisfaction with a slow-loading website is a constant source of negative experiences. This not only drives away potential customers but also undermines the loyalty of existing ones. A poor first encounter with your site can permanently damage your brand’s reputation, as users associate slow performance with incompetence or a lack of care. In the digital world, speed is synonymous with professionalism and reliability.
Prioritizing Performance: An Investment in Future Stability
Viewing website speed as an architectural priority, rather than a last-minute fix, is an investment in the future stability and growth of your business. It is a guarantee of higher sales, more satisfied customers, and a stronger market position. Prioritizing performance means creating a resilient digital infrastructure that can adapt to changing user expectations.
Website Load Time as an Architectural Priority
Website load time is not just a technical specification: it is a fundamental pillar of digital success. It is the new currency standard that determines the value of your online presence, directly impacting revenue, reputation, and customer loyalty. To thrive in today’s high-speed digital environment, performance optimization must be an architectural priority integrated into every stage of your website’s design and development. Do not let milliseconds cost you millions.
Tips for Website Speed Optimization
Choosing the right hosting provider and optimizing server configuration are often underestimated aspects of digital speed. High-quality hosting featuring SSD storage, sufficient RAM, and processing power, along with a properly configured web server (such as using Nginx instead of Apache for specific workloads), can significantly improve TTFB and overall load times.
Regular maintenance of the database, the use of compression such as Gzip or Brotli, and the implementation of HTTP/2 or HTTP/3 are also key factors for a faster user experience, contributing to better SEO.
To achieve maximum speed, especially on mobile devices, it is essential to prioritize the critical rendering path. This involves loading the most important CSS and JavaScript files inline or asynchronously so that “above the fold” content renders quickly while less vital resources load later. Utilizing techniques such as “tree shaking” for JavaScript and “critical CSS” generators can significantly reduce render-blocking resources and improve Core Web Vitals, ensuring a smoother user experience and better rankings in Google.
Do you need professional website maintenance? Explore our services.
Primary Tools for Evaluating Website Speed
Google PageSpeed Insights: The Ideal Load Time in 2025?
Google PageSpeed Insights (PSI) is an excellent choice for beginners, as it provides clear recommendations and integrates data from real users.
This tool is critical for evaluating performance. PSI provides both Lab Data (collected in a controlled environment for troubleshooting) and Field Data (collected from real users visiting your site). The combination of these data points offers insight into real-world loading speeds and helps monitor and improve performance.
Google PageSpeed Insights classifies user experience as “Good,” “Needs Improvement,” or “Poor” based on established Web Vitals thresholds.
While PSI utilizes Google’s Lighthouse for its analysis, there may be slight variations in results compared to tools like GTmetrix due to differences in testing locations, hardware, network conditions, and Google’s specific processing methods.
GTmetrix
This tool is also widely popular for evaluating and reducing website load times.
GTmetrix combines Performance (60%) and Structure (40%) scores into a letter grade ranging from A to F.
- The Performance section measures real loading metrics such as LCP (Largest Contentful Paint), FCP (First Contentful Paint), and the Speed Index.
- The Structure section evaluates how well the page is built according to performance best practices.
Like Google PageSpeed Insights, GTmetrix is powered by Lighthouse: however, their scores are not directly comparable due to differences in the testing environments.
Lighthouse:
This is the third primary tool for evaluating site performance. Most analysis tools utilize Lighthouse to simulate how a browser loads your site, subsequently assessing issues based on key metrics such as FCP, TTI (Time to Interactive), and total page size.
If you are interested in learning more about the differences between site speed monitoring tools, check out our article: Lighthouse vs GTmetrix: Choosing a Site Speed Tool.
Frequently Asked Questions (FAQ)
Why is website load time so important today?
Load time is critical because it directly impacts user experience, bounce rates, conversions, revenue, and SEO rankings. Users expect immediate access to information and content, especially on mobile devices.
What are Core Web Vitals and why do they matter?
Core Web Vitals are a set of Google metrics (LCP, INP, CLS) that measure actual user experience. They are important because Google uses them as a ranking factor in search results, meaning strong performance in these areas can improve your website’s visibility.
What is the ideal website load time?
The ideal website load time is under 2 seconds. For mobile devices, the goal is to achieve times under 3 seconds, as more than half of mobile users abandon a site that takes longer to load.
What is CLS (Cumulative Layout Shift) and how does it affect user experience?
CLS measures the visual stability of a page’s layout. A high CLS means that page elements shift unexpectedly during loading, which is highly frustrating for users and can lead to accidental clicks. Optimizing it is essential for both user experience and SEO.
What are the main benefits of using a CDN (Content Delivery Network)?
A CDN accelerates site loading by distributing content across servers worldwide and delivering it from the location closest to the user. This reduces latency, improves reliability during high traffic, and often provides additional security features.
Can a slow website damage my brand reputation?
Yes, definitely. A slow website is associated with lack of professionalism and poor customer care. This leads to negative reviews and reduced trust, which can permanently damage your brand image in the minds of consumers.
What is the difference between LCP and TTFB?
TTFB (Time to First Byte) measures the time until the first byte of data is received from the server, marking the very start of loading. LCP (Largest Contentful Paint) measures the time until the largest visible element on the page is rendered, which is a more direct indicator of when the user sees meaningful content.
How often should website speed be checked and optimized?
Website speed should be monitored and optimized regularly, at least monthly, or whenever significant changes are made to content, design, or functionality. Tools like Google PageSpeed Insights and Google Search Console provide valuable data for ongoing tracking.