Lighthouse vs. GTmetrix: Why Do the Results Differ?
The Battle of Environments: Simulation vs. Observation
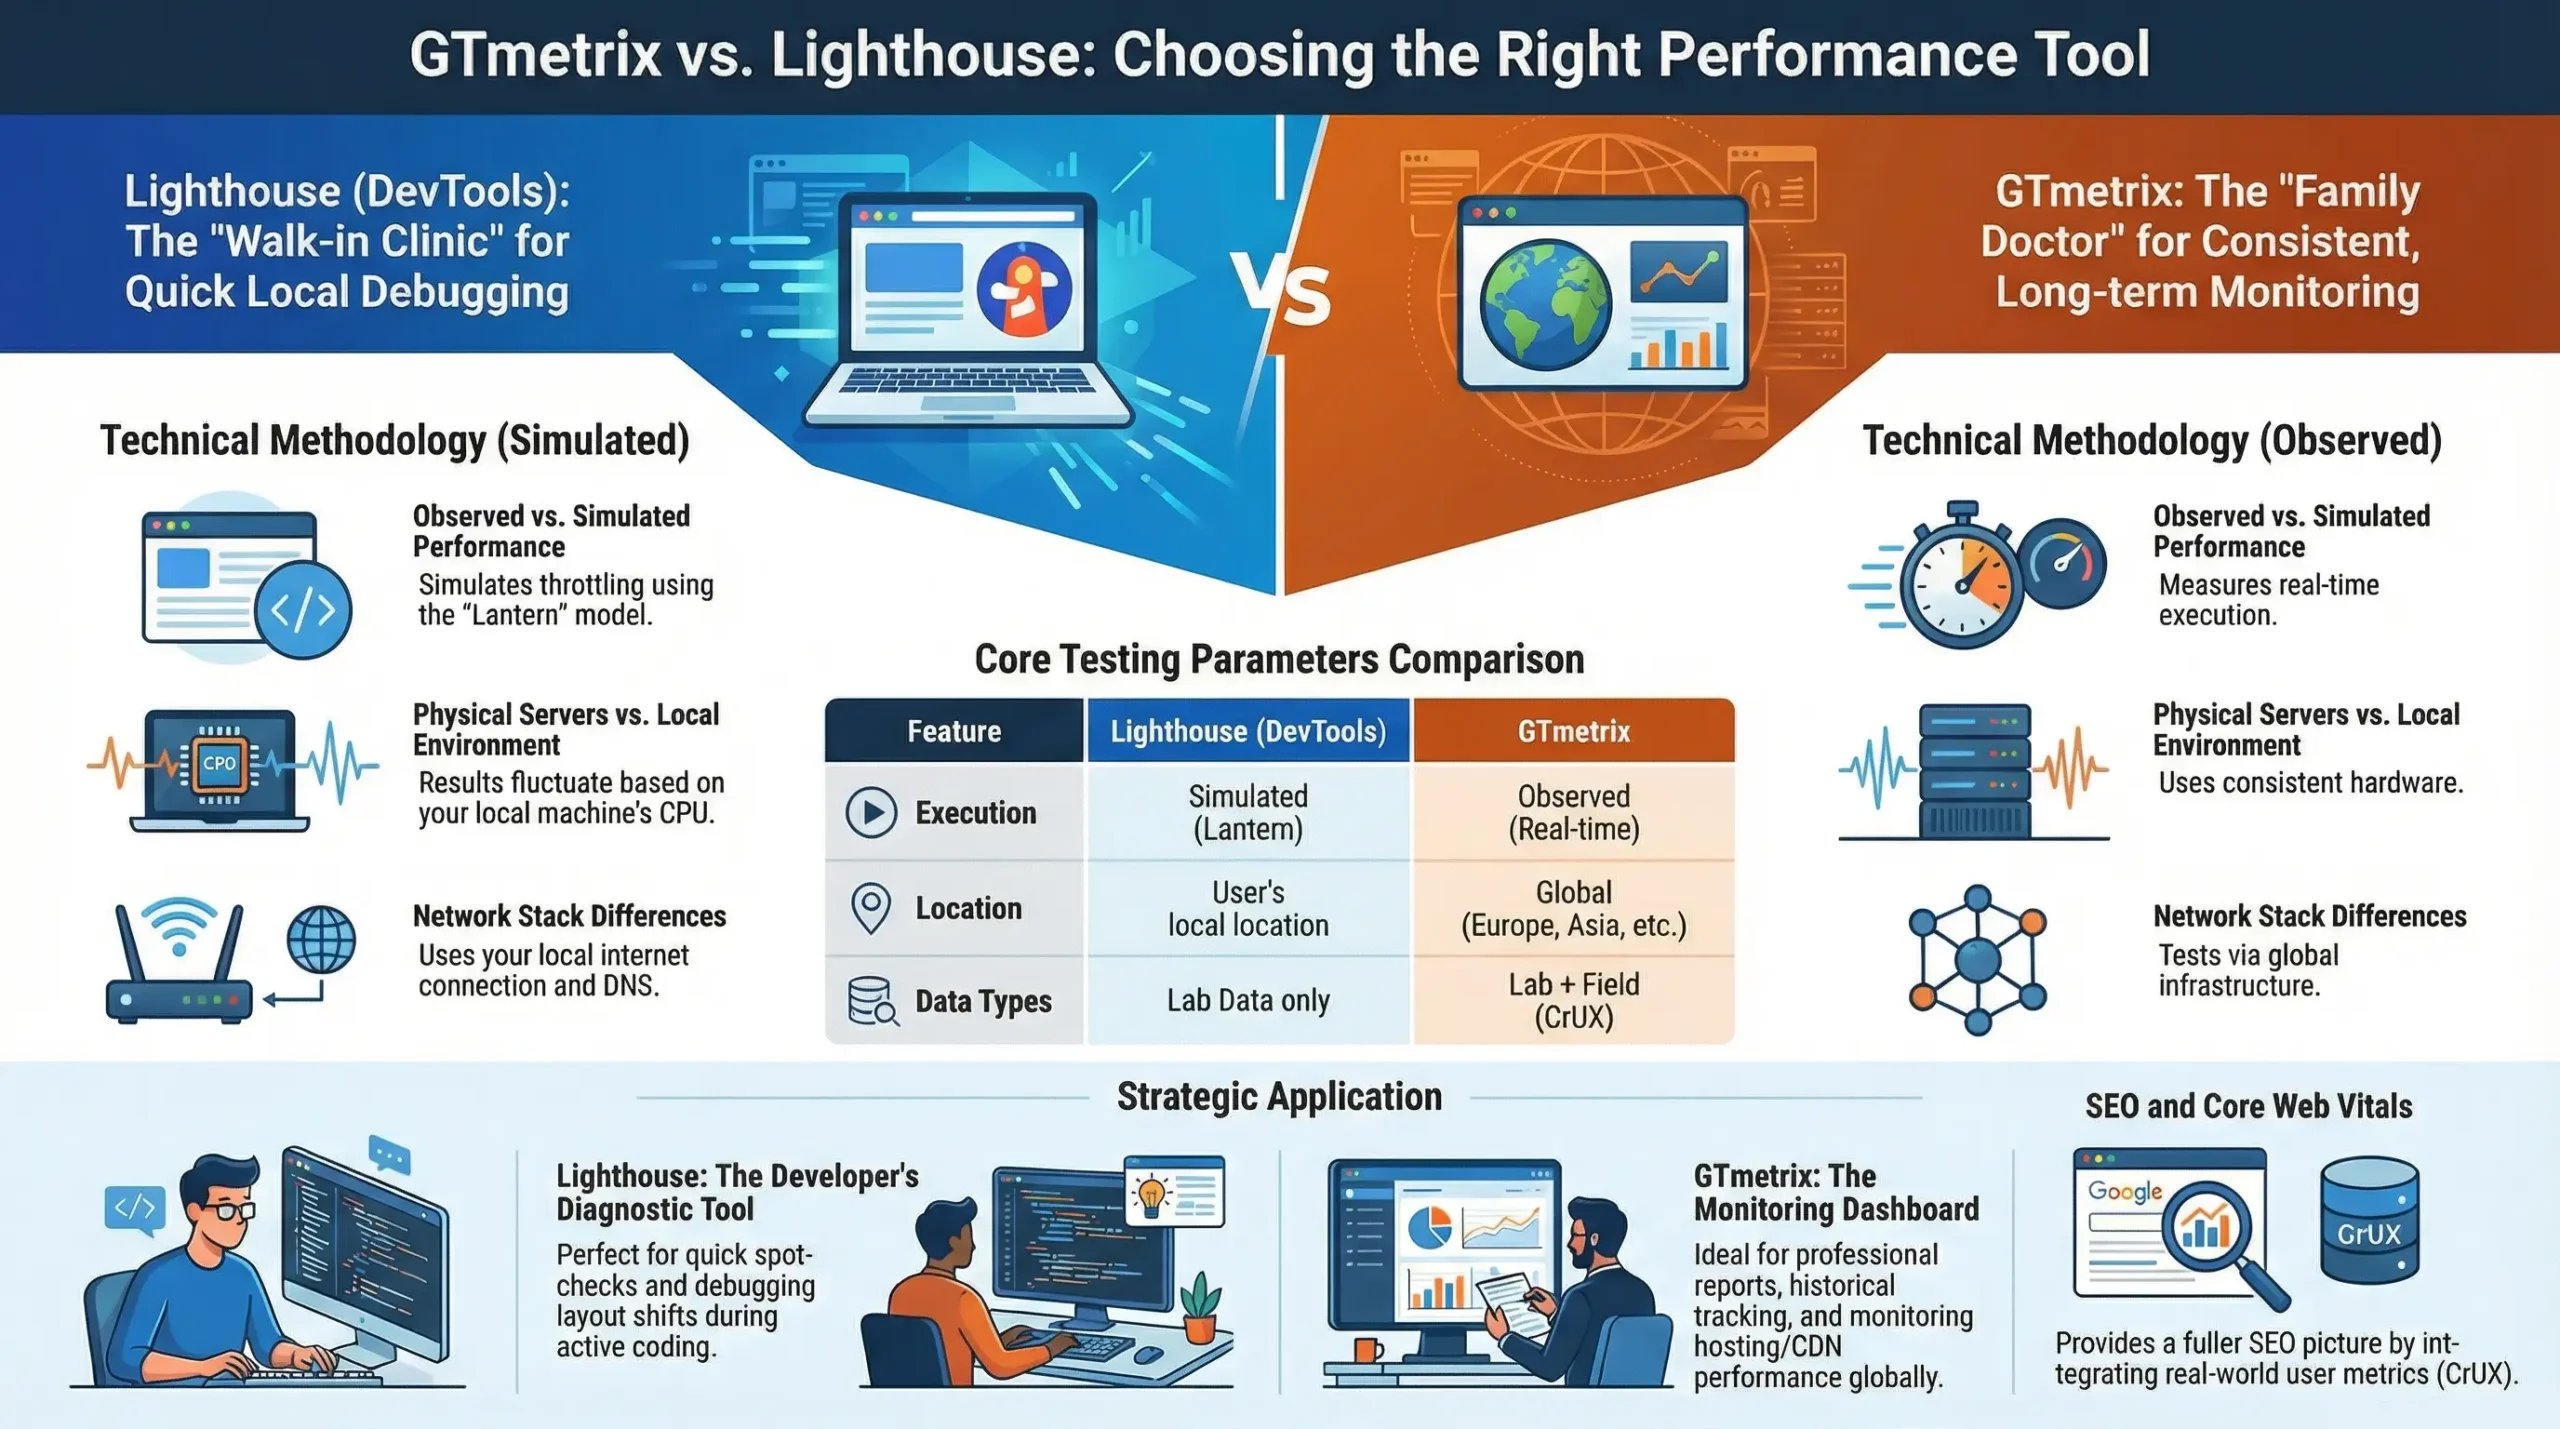
When developers measure website speed, they often encounter a frustrating issue: the results from Lighthouse in Chrome DevTools and those from GTmetrix rarely align. This discrepancy is not a calculation error but a fundamental difference in methodology and execution environments. Choosing between Lighthouse and GTmetrix depends on whether you require a local snapshot or consistent performance monitoring.
The critical technical distinction lies in how these tools simulate or observe network and hardware conditions. This “Simulation vs. Observation” battle defines the reliability and context of your data.
Lighthouse (DevTools): Dependence on Local Hardware
Lighthouse, built directly into the Chrome browser, was designed as a developer tool for rapid diagnostics. Consequently, its analysis is heavily dependent on the local machine performing the test.
Simulated Performance (The Lantern Model)
The tool achieves Simulated Performance using the Lantern model. The process works as follows: the page first loads at maximum unthrottled speed. Subsequently, simulated throttling of the network and CPU is applied to modify the results and mimic slower real-world conditions.
The Impact of Local Factors (CPU, Extensions, Cache)
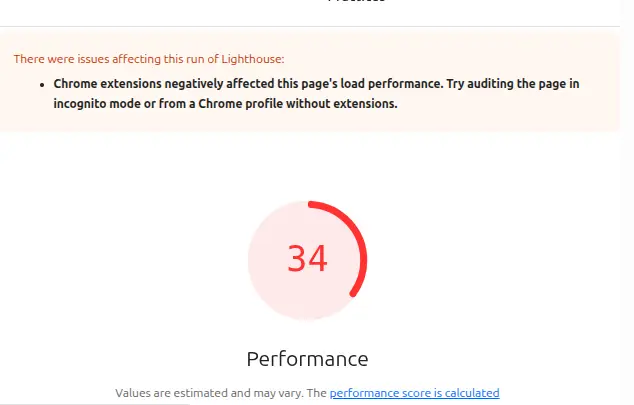
The primary challenge is that your local CPU, active browser extensions, DNS resolution, and browser cache directly influence the measurement. Results can vary significantly from one machine to another because the efficiency of JS parsing, rendering, and layout tasks depends on your computer’s current workload. Even having a resource-intensive tab open elsewhere in your browser can skew the scores.
Applicability: Rapid Spot Checks
Because of these variables, Lighthouse in DevTools is an excellent instrument for spot checks during the development process. It is ideal for testing local changes and quickly identifying immediate bottlenecks. However, since its results are environment-specific, they often appear better than what actual users experience, as simulations do not always fully capture real-world complexities.
GTmetrix: The Controlled Truth
GTmetrix is designed as an online platform for laboratory testing, with the objective of providing stable and reproducible measurements of load times. We offer professional website speed optimization that utilizes GTmetrix as a primary diagnostic tool.
Real Execution and Observed Performance
Unlike the Lantern model, GTmetrix employs real execution of the page on a physical server. This means the page loads in an actual browser (Chrome) on a remote server, where network and CPU constraints are applied directly during the loading process rather than through post-load simulation. Results are observed and recorded in real time, ensuring authentic temporal values.
Consistent Hardware and a Controlled Environment
The key advantage of GTmetrix is its controlled environment. Tests are conducted on consistent hardware with fixed resources and without background processes or browser extensions that could influence measurements. This ensures a high degree of reproducibility and reliability, which is essential for comparing performance over time or between different versions of a website.
Customization and Global Testing Locations
GTmetrix offers extensive customization options, including a choice of various global testing locations (such as the USA, Europe, and Asia), different connection speeds, and device types. This allows developers and website owners to evaluate performance from the perspective of different target audiences and regions.
Data and Trust: Beyond the Laboratory
Understanding the distinction between “lab data” and “field data” is fundamental when selecting the right tool.
Lab Data vs Field Data
- Lab Data (Laboratory Data): These are measurements taken in a controlled environment with predefined settings. They are extremely useful for debugging and regression testing but may not fully reflect the actual experience of users. Both Lighthouse and GTmetrix provide Lab Data.
- Field Data (Real User Data): These are measurements collected from actual users visiting the website. This data reflects the real-world experience, accounting for the diversity of devices, network conditions, and geographical locations. The Chrome User Experience Report (CrUX) is the primary source of Field Data.
For businesses seeking stable performance and proactive problem prevention, we provide professional website maintenance, which includes Core Web Vitals monitoring and comprehensive technical upkeep.
The Limitations of Lighthouse as a Lab Data Tool
While Lighthouse is a Lab Data tool, its reliance on the local environment makes it an “unstable” Lab Data instrument. Results can be misleading and are not always a reliable basis for comparison or long-term monitoring. It does not provide Field Data, and its simulations do not always correspond to the actual user experience.
GTmetrix and CrUX Integration (Real-User Metrics)
GTmetrix provides high-quality and consistent Lab Data, making it excellent for benchmarking. Furthermore, GTmetrix offers integration with CrUX (Chrome User Experience Report), allowing users to see how their website performs for real users in Google Chrome. This combination of controlled Lab Data and real Field Data via CrUX provides the most complete performance picture.
When and Which Tool to Use?
Lighthouse (DevTools): Excellent for Immediate Intervention
Use Lighthouse when:
- You are developing locally and need quick feedback on the performance impact of a specific change.
- You are identifying immediate bottlenecks in JavaScript, CSS, or page structure.
- You are performing spot checks on a specific page during the development phase.
- You need a detailed report with specific optimization recommendations to apply immediately.
GTmetrix: For Long-Term Analysis and Monitoring
Use GTmetrix when:
- You need stable, reproducible results for benchmarking and comparisons over time.
- You are monitoring website performance after implementing major changes or tracking trends.
- You are comparing your performance against competitors.
- You want to see how your site performs from various geographical locations or under different network conditions.
- You seek a combination of Lab Data and Field Data through CrUX integration for a comprehensive view of the user experience.
Choosing Based on the Objective
Do not view Lighthouse and GTmetrix as competitors. They are highly useful and complementary tools. Each has its specific place in the arsenal of a developer or website owner. Selecting the right tool depends on the specific goal and context of the measurement. While Lighthouse is excellent for quick local checks and debugging, GTmetrix is indispensable for reliable monitoring and long-term performance analysis.
If you require stable observation and proactive maintenance, explore our website technical support service.
Performance indicators, such as those from Lighthouse and GTmetrix, are not just technical details; they are critical indicators of user experience and directly impact search engine rankings, especially with the growing importance of Core Web Vitals. These vitals are a core part of the technical SEO optimization services we offer.
Google increasingly prioritizes websites that offer a fast, smooth, and stable user journey. On our technical SEO optimization page, you can see how we work with these metrics to improve real-world site performance. Understanding how each tool helps identify issues related to Largest Contentful Paint (LCP), First Input Delay (FID), and Cumulative Layout Shift (CLS) is paramount for any website owner aiming for better visibility and higher conversion rates.
A slow site frustrates users, leads to higher bounce rates, and ultimately undermines SEO efforts. Although both tools provide invaluable data, a common misconception is focusing solely on achieving a perfect score rather than understanding the underlying issues. The ultimate goal is to improve the actual user experience, which often means prioritizing fixes that have the greatest real-world impact.
Developers should avoid the trap of optimizing only for the numbers displayed by a specific tool. Instead, they should interpret the diagnostics to make informed decisions that truly enhance site performance for all visitors, regardless of device or network conditions. This approach ensures sustainable improvements rather than short-term gains that may not lead to better business results.
If you need a diagnosis or performance improvement, see our Technical SEO Support service. We also offer speed optimization aimed at real improvements in LCP, INP, CLS, and loading fluidity.
Frequently Asked Questions (FAQ)
Which tool is “better” – Lighthouse or GTmetrix?
Neither is definitively “better,” as they serve different purposes. Lighthouse is designed for rapid local checks and debugging, whereas GTmetrix is intended for consistent monitoring and benchmarking within a controlled environment.
Can I use Lighthouse and GTmetrix together?
Yes, absolutely! Using them in combination provides the most comprehensive view of website performance. Lighthouse identifies issues during the development phase, while GTmetrix validates those changes and tracks long-term trends.
Why do my Lighthouse results vary so much?
Lighthouse results launched from DevTools are heavily influenced by the local environment, including CPU load, active browser extensions, open tabs, and internet connection. Variations are normal since the tool simulates conditions based on your current machine’s performance.
What is CrUX and why is it important?
CrUX (Chrome User Experience Report) consists of data from real Chrome users, reflecting actual website performance, known as “Field Data”. These metrics are vital because they show the real-world experience. GTmetrix can integrate this data to provide a more complete performance picture.
How often should I test my website?
This depends on the intensity of your development. Lighthouse can be used repeatedly during active development, while GTmetrix should be used at least once a week for monitoring. Testing is mandatory after making major changes. You can also use our monitoring and support service if you require automated tracking.